Module_11
- Angela Porcelli
- Mar 26, 2021
- 4 min read

Updated: Mar 29, 2021
This assignment has 2 parts
Original data part 1: Covert the Florida Department of Health's COVID-19 cases Excel sheet to Python.
I had some issues with the Pandas package in the last assignment so I decided to approach this assignment from two different code editors, Visual Studio Code (VSC) and Anaconda.
Since I have been using Visual Studio Code, I started with this method. Just like in the Module_10 assignment, Pandas kept triggering error messages. I verified that I was working in a virtual environment and unload and reloaded Pandas, but this didn't help. I consistently received the error below and could not find solutions on blogs, chats, or tutorials.
AttributeError: module 'pandas' has no attribute 'read_excel'
Since I couldn't get Pandas to run, I searched for code ideas that didn't include the 'import pandas as pd' code line. I found the following code and ran it through VSC.
import csv import xlrd import sys def ExceltoCSV(excel_file, csv_file_base_path): workbook = xlrd.open_workbook(excel_file) for sheet_name in workbook.sheet_names(): print('processing - ' + sheet_name) worksheet = workbook.sheet_by_name(sheet_name) csv_file_full_path = csv_file_base_path + sheet_name.lower().replace(" - ", "_").replace(" ","_") + '.csv' csvfile = open(csv_file_full_path, 'wb') writetocsv = csv.writer(csvfile, quoting = csv.QUOTE_ALL) for rownum in xrange(worksheet.nrows): writetocsv.writerow( list(x.encode('utf-8') if type(x) == type(u'') else x for x in worksheet.row_values(rownum) ) ) csvfile.close() print(sheet_name + ' has been saved at - ' + csv_file_full_path) if __name__ == '__main__': ExceltoCSV(excel_file = sys.argv[1], csv_file_base_path = sys.argv[2])
I added parenthesis around the print commands in lines 8 and 19 and received the following error.
ModuleNotFoundError: No module named 'xlrd'
I tried installing xlrd using pip install, but VSC would not install the module. So I tried running the following code (I did not write this code).
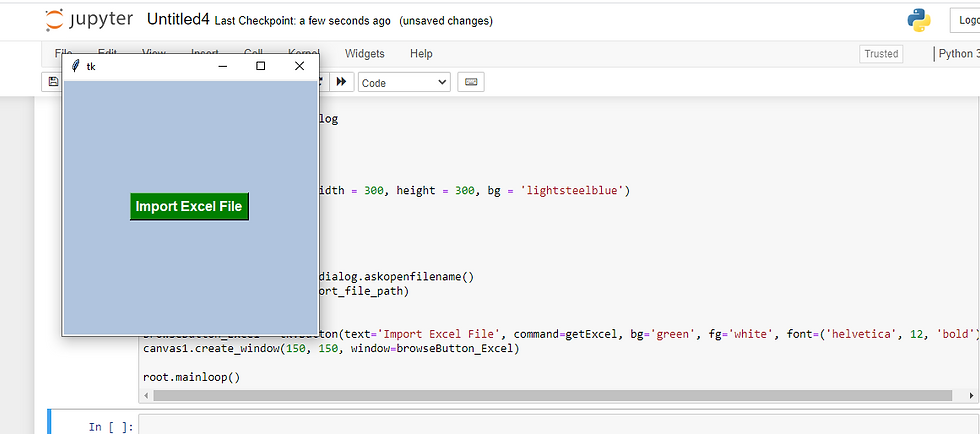
import tkinter as tk from tkinter import filedialog import pandas as pd root= tk.Tk() canvas1 = tk.Canvas(root, width = 300, height = 300, bg = 'lightsteelblue') canvas1.pack() def getExcel (): global df import_file_path = filedialog.askopenfilename() df = pd.read_excel (import_file_path) print (df) browseButton_Excel = tk.Button(text='Import Excel File', command=getExcel, bg='green', fg='white', font=('helvetica', 12, 'bold')) canvas1.create_window(150, 150, window=browseButton_Excel) root.mainloop()
This time I received an error code saying Pandas is not installed even though I had reinstalled this package prior to running the code. I think I have a major issue with VSC at this point and am going to try to uninstall and reinstall the program. I know VSC will open the file if I first convert it from an Excel file to a csv file. To do this I opened the file in Google docs and saved it as csv file COVID19_ByCounty. On VSC, I went to file->open file-> downloads->COVID19_ByCounty. and received the following output.

The data is all there, however, without pandas data frame, you can't really work with the data.
I decided to download Anaconda and pull the file through a Jupyter notebook running Python3. I used the same tkinter code that I ran on VSC, and this time received a usable output.
The code prompted a popup box the let me select which Excel file I wanted to import.
I chose the original Excel sheet (not the csv download) for this assignment and the data was returned in a table format!

See this assignment on GitHub:
Original data part 2: Preform Web scrape from any website you like and report on your finding.
For part 2, I used JupyterLab, and for my data set I pulled the race results from Dunedin's 2018 Hog Hustle 5K.
The first thing I did was import the packages Pandas, Numpy, and Matplotlib into my notebook. Then I pulled Urlopen, BeautifulSoup, and Re into the notebook.
import pandas as pd
import numpy as np
import matplotlib.pyplot as plt
from urllib.request import urlopen
from bs4 import BeautifulSoup
import re #for reformatting
Next I assigned the url for my dataset to the variable 'url' and used urlopen to pull the site's data in html. I assigned BeautifulSoup to variable BS and used it to pull the html from the url.
url="http://frrm.raceresults.space/2018/2018_HogHustle_OA.htm"
html=urlopen(url)
BS = BeautifulSoup(html) #import url info to BS
Now I'm ready to indicate what aspects of the original dataset I want to collect. I want to get the title and links associated with this dataset.
title = BS.title
print(title.text)
links = BS.find_all('a', href=True)
for link in links:
print(link.get("href"))
I also want to pull the data from the site. Since I am exploring the web scrape process, I'm going to pull all the data. Normally, I would be more selective about the data and only pull what would be relevant for the analysis.
data = []
allrows = BS.find_all("tr") #data element
for row in allrows:
row_list = row.find_all("td") #data cells
dataRow = []
for cell in row_list:
dataRow.append(cell.text)
data.append(dataRow)
print(data)
The return is is a large amount of data that is hard to read because it is just continuous text. To get a better view of the data I'm going to put it in a table format.
df = pd.DataFrame(data)
print(df)
As a data frame, the information is easier to comprehend, but I still have 346 rows and 10 columns to look at. I'm going to narrow the data further in order to analyze it. I want to know if age (column 4) has any impact on the runner's pace (column 9). I also want to narrow the rows down, so I'll take the top and bottom five rows as a sample. I hade to pull six lines from the top dataset rows, since the column headers were entered as row 1 data instead of actual headers.
df2 = df[[(4),(9)]]
df2 = df.dropna(how='any')
print(df2[[(4),(9)]].tail())
print(df2[[(4),(9)]].head(6,))
Lastly, I'm going to graph the data to visually see if there is a correlation. I created a boxplot to accomplish this. If this was a research project I would have spent more time defining aspects of the boxplot and created a couple other visualizations to determine which one does the best job at conveying the data. For the purpose of this assignment the boxplot suffices.
np.random.seed(70)
df = pd.DataFrame(data = np.random.random(size=(10,2)), columns = ['Age','Pace'])
df.plot(kind='box')
plt.show()

See this assignment on GitHub:


Comments